
So you’re implementing “agile”, and you’ve got the team working well but interfacing with the wider organisation and some of those shared functions is still a bit tricky.
You know how every month we get near the end and seem to spend far too much time reconciling and tallying up, “working the numbers” (fudging), taking away from what we should be doing to instead focus on making the numbers fit for Finance and our external stakeholders?
Well what if there was a way to know exactly where you stood, with greater accuracy every two weeks, in line with your iterations?
What if you could demonstrate your value cumulatively over time, show return on investment as you worked, and break free from monthly cycles whilst still meeting all of the Corporate Finance requirements including external reporting and alleviating *their* headaches at the same time?
And what if this could take 20-30% off your administration costs because the new way was also more efficient?
Here’s how we did it for a $1B p/a business….
What you’ll need:
-
Teams working in a synchronised rhythm of fortnightly iterations – each team starts and ends their work period or “sprint” on the same day
-
A conversation with each team at the end of their 2-week sprint – I liked to do mine in person where possible to encourage leaders to stay “in the work”
-
Some historical cost data
-
Paper and a pen
Now there’s nothing to say you can’t do this with longer iterations, work periods that run out of sync, digital reporting or “zero touch” tools – but I’m telling you how to make your life easier and giving you the “ideal” to aim towards that’s in line with the values and principles of servant leadership and visual management. I’m here to de-clutter, not over-complicate.
How it works:
I’m going to describe the process for one team, and all we do for bigger businesses is repeat and then stack up the results. It goes something like this:
First, understand the work
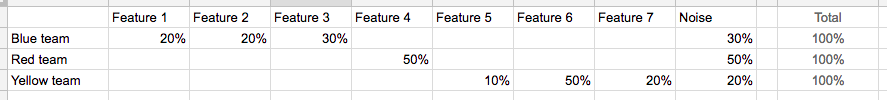
At the end of each iteration, get the team together and ask two questions:
1. Where did you spend your time these past 2 weeks ?
2. Roughly how much time was taken up working on “noise” ?
We want to know the % split across the top 2-3 “features”, not the detail of every task completed. And we want to know the drag on our productivity from the noise – those tasks not related to the project, or distractions away from what we agreed we’d work on at the beginning of the iteration.
The output might look something like this:

Next, price the team
Here’s where you’ll need some historical cost data. You’ll want say the last 6-9 months of expenses for the whole team and work out the average run rate per month. Be sure to include managers, project managers, admin staff in the “team”
Here’s what it might look like:
-
As a leader, I have 3 delivery teams each with 6-8 people in a team. I also have 3 project managers, a group test manager and a project assistant in my total team.
-
Our monthly charge for everyone in the team (including me) total $60k per month average spend
-
Therefore our price per team is $20k per month or $10k per fortnightly iteration (sprint)
End of conversation.
I’m not interested that one team has 6 people and the other has 8, that Mary is more expensive as an individual than Joe, and I’m not interested that as a manager or support staff we’re not working directly on the projects. I don’t need to know down to the cent because we’ve got bigger fish to fry.
-
I want to price the team including the support work, because without it, the team wouldn’t function. It also provides me more incentive to reduce non-delivery overheads in my business.
-
If team size varies significantly then I’m still feeding work to project-specific teams, rather than breaking work down into smaller chunks and letting teams move to the work (regardless of a bigger parent-project) and this method of costing will probably just complicate things further.
-
Non-labour costs are directly attributed to the relevant work – eg storage to support a software delivery, or travel for certain team members. I could also use the same method above for shared support costs, eg video conferencing for the whole team divided equally across 3 delivery teams.
Finally, pull the costs together
So I know how the team spent their time every two weeks, and I know how much they cost, it’s simple math to produce a cost per work item or “feature” – let’s look back at the Blue Team.
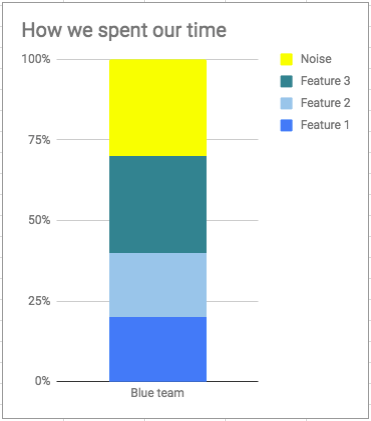
@ 10k per sprint, in this sprint we spent:
-
$2,000 each on Features 1 and 2;
-
$3,000 on Feature 3; and
-
$3,000 on other things that came up or distracted us
-
Add-on any feature-specific costs like travel or storage for IT systems
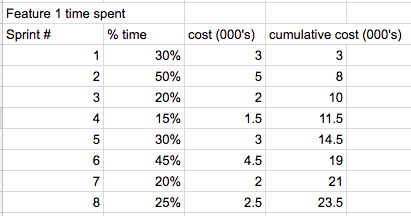
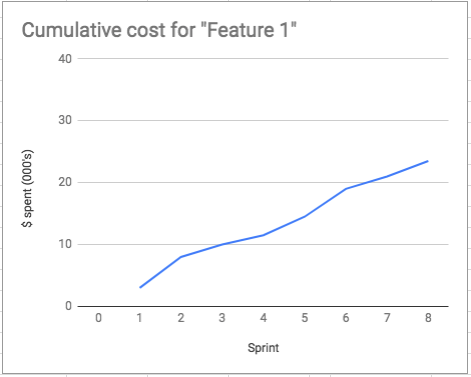
As we build data over time, we get a cumulative cost per feature:
Visibility and accuracy improves because:
-
We talk more regularly about how we spend our time, as a whole team, which creates safety for individuals and shared accountability
-
We acknowledge that distractions come up, and leaders take action to help minimise noise because they see the impact it has on the team’s ability to complete high priority work
-
Individuals no longer book time sheets to old reporting codes; no longer book to a project because it has money whilst the one they worked on doesn’t; we have visibility of the noise instead of hiding it by inflating costs to funded projects (which makes us appear slow and expensive)
-
When we display this information visually, in a prominent position in our workplace then anyone can come to see the latest at any time
-
The visual tool becomes a single point of truth for all outgoing reports and correspondence
-
Because it’s visible, any oddities get captured early and worked through
-
A few key reasons Finance now love us:
-
End of month becomes a breeze because there’s only ever 2 weeks to reconcile *at most*
-
You never have to chase us for time sheets because we settle costs every two weeks in line with iterations – Our run rate becomes predictable, there’s very few surprises
-
We can capitalise assets as we go, as each chunk of value (“feature”) is delivered – and if you’ve got the sizing of your work right, that means there’s no excuse to carry Work In Progress (WIP) open for more than 3-6 months. So there’s no big push at the end of the year to try and “close out WIP” in time for issuing the financial statements to investors.
Next month: Demonstrate return on investment by overlaying benefits
